

The NSE All-Share Index and Market Capitalization depreciated by 0.42% and 0.38% to close the week at 41,001.99 and N21.449 trillion respectively.
Monday; the week started on the backfoot, as the benchmark All-Share Index dropped by 0.23%, as a result of loses in Dangote Cement Plc (DANGCEM: -1.0%), FBN Holdings Plc (FBNH: -3.9%) and Flour Mills of Nigeria Plc (FLOURMILL: -5.5%).
Insurance Stocks started the week where it left off, with a 5.98% advancement of its Index, making it the best performing index on Monday, 18th January, 2021. Oil and Gas Index advanced by 0.02%, while the Banking Index advanced by 0.01%. Industrial Goods Index and Consumer Goods Index declined by 0.43% and 0.62% respectively.
Tuesday; NSE All-Share Index continued to decline on Tuesday, dropping by 0.07%. The negative performance was driven by BUACEMENT (-1.1%), ACCESS (-3.7%) and UBA (-2.2%).
The rampant Insurance stocks continued on Tuesday, with the Insurance Index advancing by 6.29%. The Consumer Goods Index advanced alongside the Insurance Index by 0.56%. Industrial Goods Index, Oil and Gas Index and Banking Index declined by 0.36%, 0.46% and 0.73% respectively.
Wednesday; the equities market recorded its first and only gain in the week on Wednesday, 20th January, 2021, advancing by 0.23%. The positive performance was due to buying interest in WAPCO (+8.2%), UBA (+2.3%) and TRANSCORP (+9.4%).
The advancement of the Insurance Index was moderated, as the index moved up by only 2.52%. The Industrial Goods Index, the Oil and Gas Index and the Consumer Goods Index advanced by 0.50%, 0.45% and 0.21% respectively. The Banking Index declined by 0.23%.
Thursday; the local bourse returned to the negative territory, declining by 0.12%, on the back of loses in DANGCEM (-0.2%), MANSARD (-9.8%) and UBA (-1.7%).
From a moderation on Wednesday, the Insurance Index went into a deep dive, dropping 6.70%, as Investors started booking profits. The Consumer Goods Index and Banking Index declined by 0.30% and 0.23% respectively, while the Industrial Goods Index and the Banking Index advanced by 0.27% and 0.23% respectively.
Friday; the market closed negatively on the last trading session of the week, depreciating by 0.24%, as a result of loses in WAPCO (-6.98%), UBA (-1.68%) and DANGSUGAR (-0.25%).
It turned into an outright rush to get out of Insurance stock holdings on Friday, resulting in an even steeper decline of 7.93% by the Insurance Index. The Industrial Goods Index, Oil and Gas Index and Banking Index all declined as well, by -0.50%, -0.29%, and -0.17% respectively. The Consumer Goods Index advanced by 0.06%.
Activity level
A total turnover of 4.288 billion shares worth N25.989 billion in 32,849 deals were traded this week by investors on the floor of the Exchange, in contrast to a total of 3.447 billion shares valued at N32.725 billion that exchanged hands last week in 30,327 deals.
The Financial Services Industry (measured by volume) led the activity chart with 2.607 billion shares valued at N12.454 billion traded in 15,128 deals; thus contributing 60.81% and 47.92% to the total equity turnover volume and value respectively.
The Conglomerates Industry followed with 813.813 million shares worth N1.561 billion in 2,417 deals. The third place was Oil and Gas Industry, with a turnover of 212.126 million shares worth N821.978 million in 2,726
deals.
Trading in the top three equities namely Transnational Corporation of Nigeria, Living Trust Mortgage Bank Plc and Japaul Gold and Ventures Plc (measured by volume) accounted for 1.582 billion shares worth N1.564 billion in 2,726 deals, contributing 36.9% and 6.02% to the total equity turnover volume and value respectively.
Three weeks into the new year, both the NSE ASI and the activity chart are still trying to establish a pattern.


Fig 1: Investogist Activity Chart – NSE All-Share Index vs Activity level (measure of volume and value of traded shares)
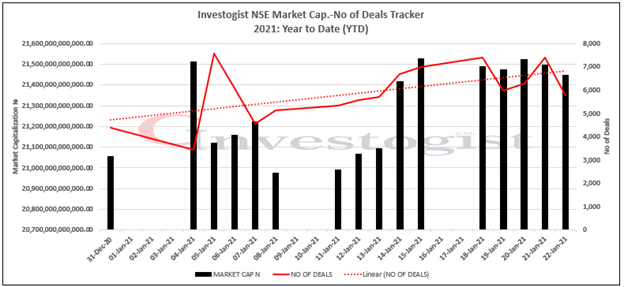

Fig 2: Investogist Activity Chart – Market Capitalization vs No of deals
In the week ending 22nd January, 2021, below is the YTD performance of the indices under our watch.
- Oil & Gas Index: -0.35%
- Consumer Goods Index: -0.56%
- Insurance Index: -1.95%
- Banking Index: -5.52%
- Industrial Goods Index: -10.60%
Below is the YTD performance of the indices under our watch.
- Insurance Index: +27.60%
- Oil & Gas Index: +21.21%
- Consumer Goods Index: +5.68%
- Banking Index: +4.42%
- Industrial Goods Index: -0.03%
Fifty-three (53) equities appreciated in price during the week, lower than sixty (60) equities in the previous week. Twenty-nine (29) equities depreciated in price, higher than nineteen (19) equities in the previous week, while seventy-nine (79) equities remained unchanged, lower than eighty-two (82) recorded in the previous week.
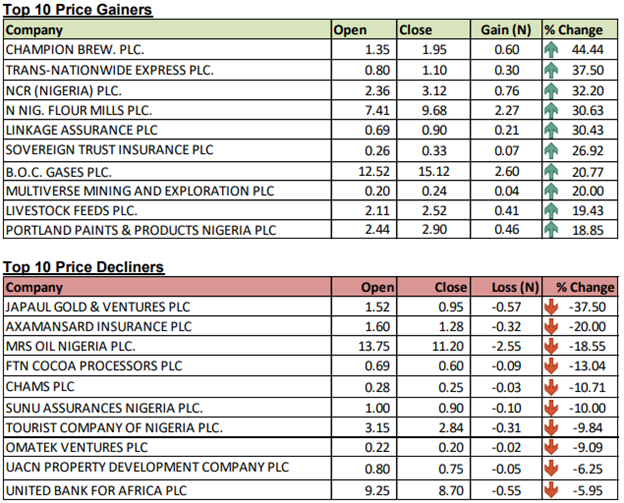

Fig 3: Source – NSE Weekly Report
Outlook
We expect bargain hunting ahead of the dividend season to drive market performance in the week.


Nnamdi Maduakor is a Writer, Investor and Entrepreneur