

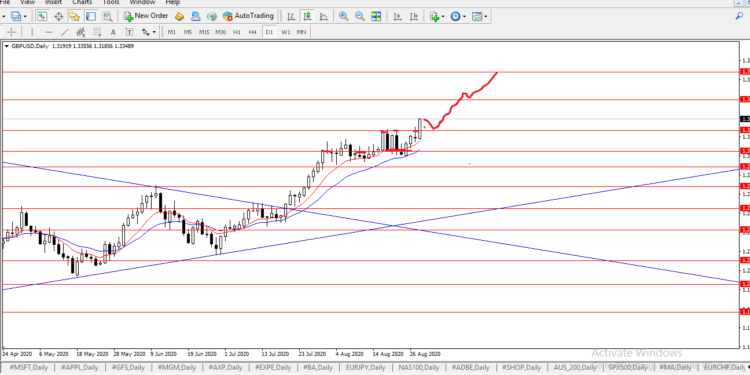
GBPUSD
The cable closed above 1.32545 resistance level on Friday. 1.32545 has played out as a tough level for buyers to break in order to send the pair higher.
Anyone who read my last weeks’ forecast already knows that I advised we take a wait and see position last week so as to let the market show us the direction it intends to take in the long run.
Friday’s rally of 156 pips closed convincingly above 1.32545. Given the extended move on Friday, a retest of 1.32545 will provide the best risk to reward ratio of 3.18R. Patience is all that is needed for this and mostly across pairs of the USD like AUDUSD, NZDUSD, USDZAR and USDNOK.
A retest of 1.32545 as support will provide a good opportunity to get long targeting 1.350 and 1.37316.
Alternatively a close below 1.32545 will negate this bullish outlook.
Read also; Nigerian Stock Exchange: Week ended 28.08.2020 review and Stock Pick for the week ahead
GBPUSD daily time frame:

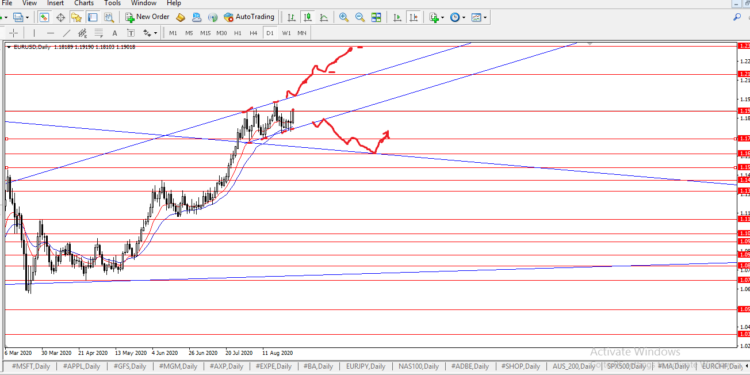
EURUSD
EURUSD continues to consolidate, even Fridays weakness experienced by USD could not breakout the most traded currency pair. I believe that the EURUSD has more potential to move higher than lower, over extended period, but might move a bit lower first here is why.
Recall the multiyear wedge pattern on the monthly time frame that broke out in July to the upside yes! That pattern, EURUSD is yet to retest the top of the wedge as support. It is also important to note that there is a slopping flag on the daily and slopping flags like this often hint at exhaustion and a possible move to the down side that does not mean that EURUSD will sell off but it is worth taking note of.
One should be careful buying EURUSD as long as it remains in this upward slopping flag, given that we have not seen any retest of the wedge top I will not be surprised to see sellers break the channel support 1.1790 and move into 1.170 followed by 1.1605/1.1550 which is the area of the wedge top before bouncing back.
A break above the channel (slopping flag) resistance will negate this structure and send the EURUSD up to 1.215 followed by 1.2350.
EURUSD daily time frame
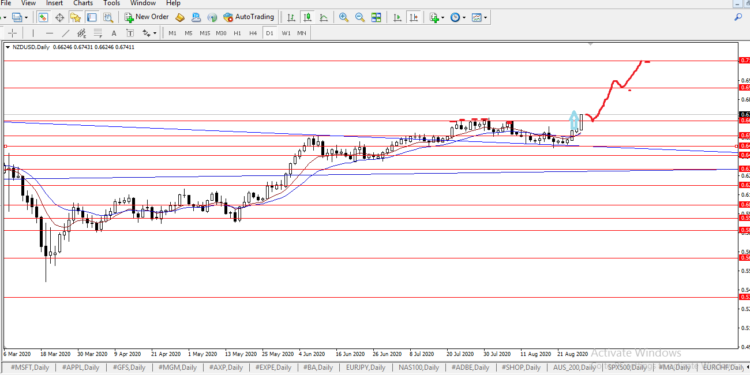
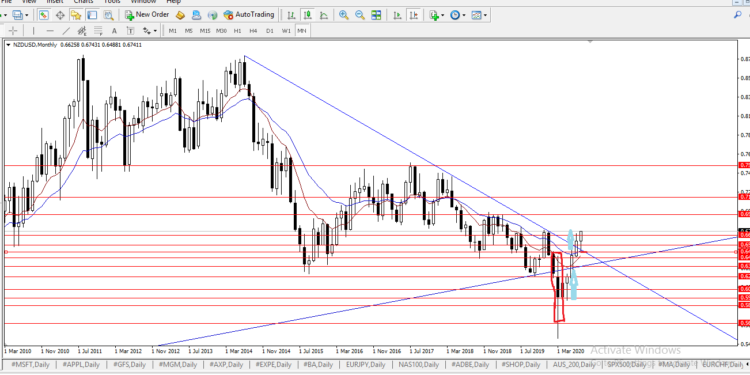
Weeks ago we discussed the multiyear wedge on NZDUSD monthly time frame. The false break that occurred in March, precipitated a bull move that broke the top of the wedge and August successfully retested the top 1.650/40 as support and bounced off it.
On the daily time frame, buyers finally broke 0.670 on Friday 0.670 resisted the kiwi from July through August. Friday’s break will most likely send the pair towards 0.694/0.700 followed by 0.7150.
NZDUSD daily time frame
NZDUSD monthly timeframe
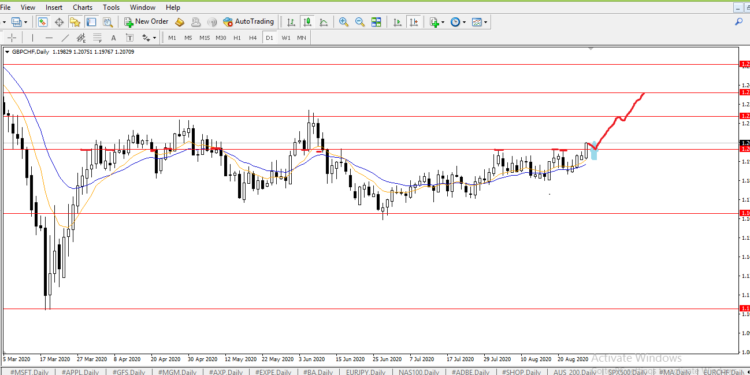
GBPCHF
GBPCHF buyers broke through 1.20340 resistance as the week ended. The bearish engulfing from 21.8.2020 did not produce enough selling pressure last week.
The eventual break of the critical resistance 1.20340, hints at strength if the level holds as support on a retest in the coming days. Key levels moving up include 1.2222, 1.2360 and 1.25230.
Alternatively if support 1.20340 breaks on retest, then we get a sell signal levels on the way down include 1.6640 followed by 1.1154.
GBPCHF daily time frame
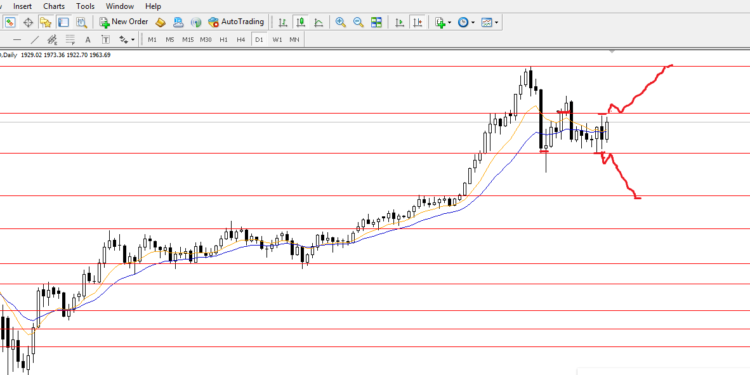
XAUUSD
GOLD continues in consolidation, there isn’t much to say here but a repeat of what we already know. Gold remains range bound between 1900 and 1980 until we get a break above 1980 or below 1900 we will not have a clear direction.
Thursday’s Jackson hole precipitated a sharp sell off from 1980, instead of the much anticipated rally Friday. However, it recovered all lost ground and gold is once again poised to move higher.
A break out either above 1980 or below 1900 will send Gold higher or lower. Gold is in a long term bull market hence I will prefer buying the dips or break outs.
XAUUSD daily time frame
Written by:
Chijioke Maduakor