

EURUSD
EURUSD has poised to be bullish ever since it confirmed a breakout from a multiyear wedge on the monthly time frame in July 2020; I discussed that wedge at length before the break and after the beak.
Since the break in 2020 the Euro has advanced up to 1.2350 which it last saw in 2018. At that point price started to slide in a descending channel also called a bull flag. On the 2nd of April buyers confirmed a false break from the bottom of the flag in the area of confluence of support at 1.17496 and sent the price up to through the bull flag and through 1.2150 resistance.
Buyers defended that level on Friday with a clear rejection candle. The year to date high at 1.2350 is exposed. A break above 1.2350 will expose 1.255 a test 1.255 will form the much needed higher high.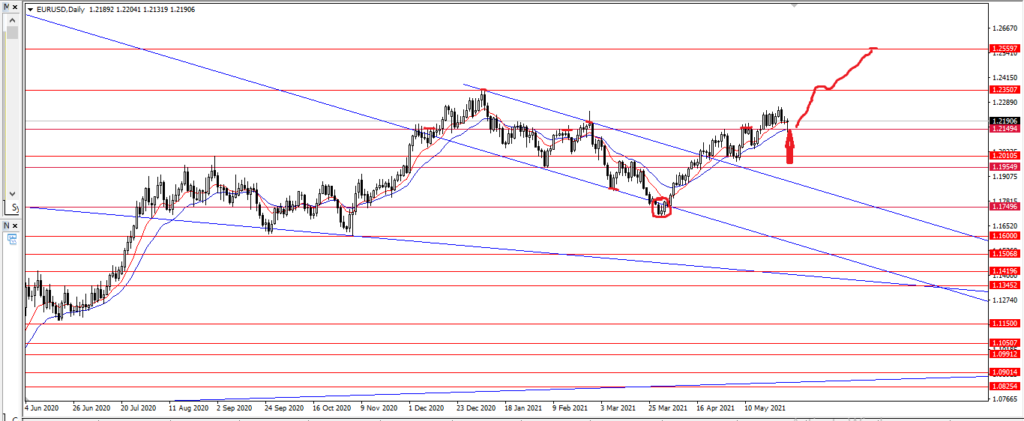

NZDUSD
The kiwi broke out of the bull flag we discussed last week on Wednesday and retested 0.7232 resistance flipped to support on Friday. Buyers however are not out of the confluence of resistance yet; 0.730 is must break level for the bulls before they can make any further gains towards 0.74625 and 0.76516
A daily close above 0.730 will confirm the bullish and expose 0.74625 and 0.765
As long as price remains below 0.730 buyers will continue to struggle where as a break back into the channel will negate the bull flag. 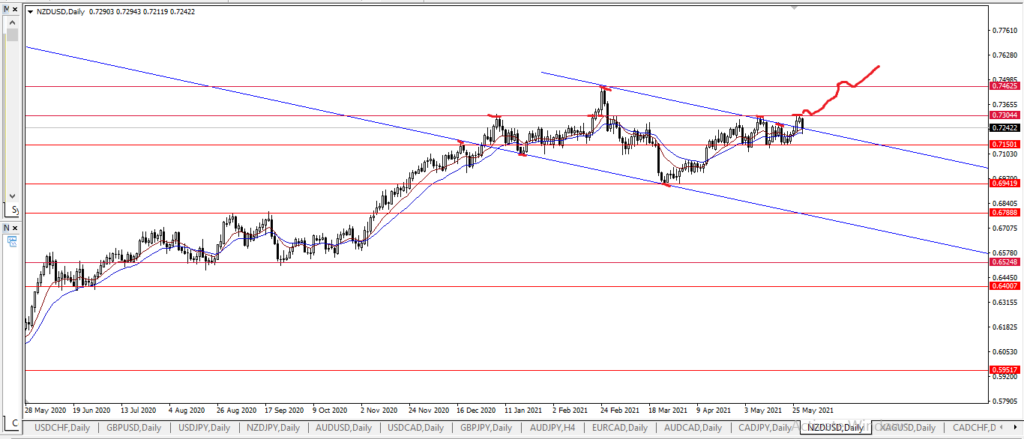

GBPJPY
We discussed the discussed the slopping flag on GBPJPY daily time frame last week. In that forecast I wrote that an upward break through 155.00 should be considered a bull trap and should handled cautiously.
If this turns out to be a false break and we get a break back into the flag a rapid move towards 152.30 and channel support 150.40 is to be expected.
A break below 150.40 will expose 148.20 followed by 144.40
General rule of thumb: A false break to one direction usually produces an extended to the opposite direction. 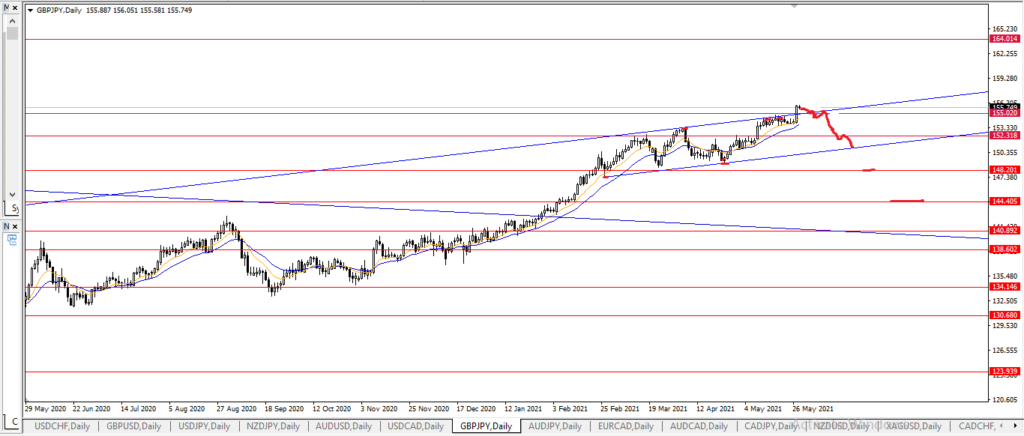

XAUUSD
We have watched Gold consolidate for months and tracked it within the descending channel aka bull flag that I have discussed for weeks now. I also wrote about the double bottom on the 31st of March and the eventual break out from the channel on the 17th of May.
Gold bulls are currently at their first objective after the break out and continues to pressure 1910 resistance. The measured objective of this bull flag lies between 2015 and the all time high at 2075.
A daily close above 1910 will open the door to 1970 followed 2015 and the all time high at 2075
As long as the price remains above the channel top this bullish scenario remains intact.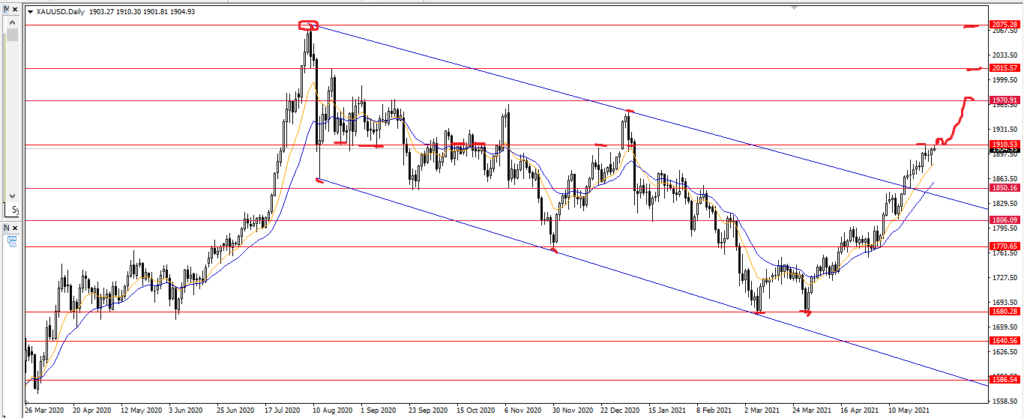

Daily time frame
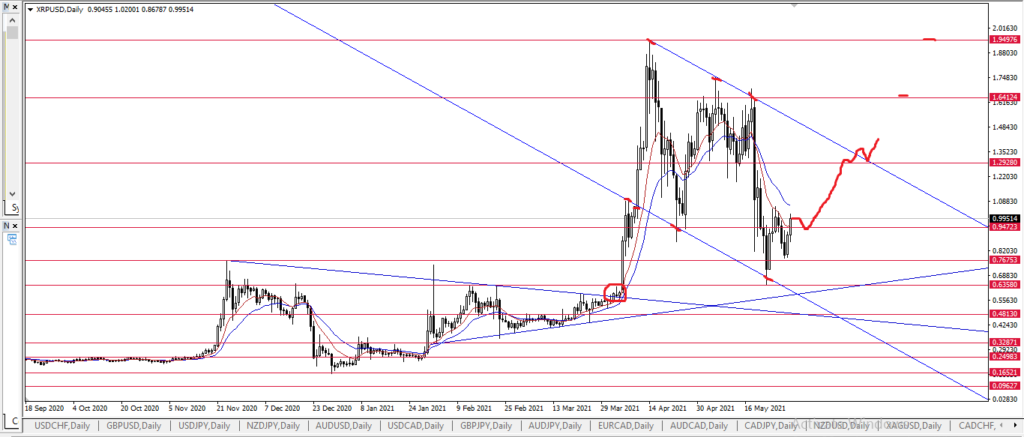
XRPUSD
Ripple is currently in a wide consolidation/continuation pattern the bull flag. I wrote about ripple when it was consolidating in the narrowing wedge and during the breakout in April after which it surged over 340%. This current consolidation upon breakout will most likely send ripple through its previous all time high at $2.770.
Currently buyers are testing 0.94723 resistance. A daily close above it will expose 1.29280 confluence of resistance. A daily close above 1.292 will confirm the flag break out thus exposing 1.641 and the year to date high 1.949 which is also the inception this bull flag.


Engineer, Entrepreneur, forex trader and Analyst