

EURUSD
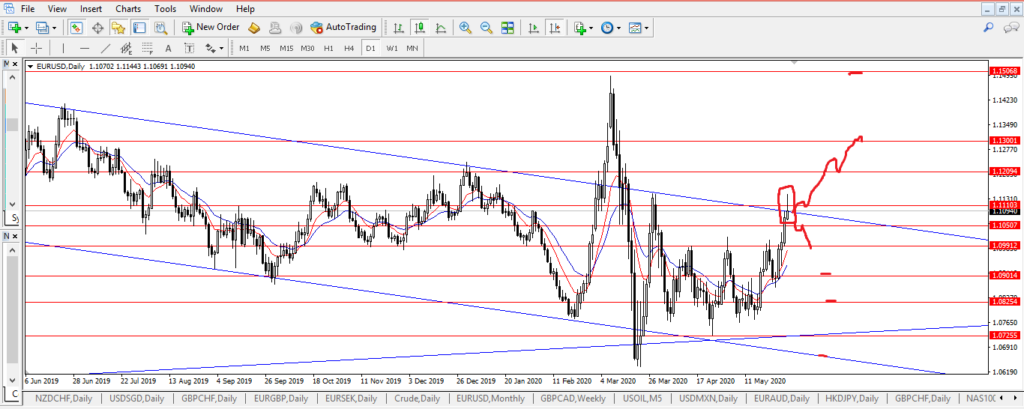

Fig 1: EURUSD Daily Time Frame
EURUSD surged last week shooting up from the multiyear trend line which forms the support of a multiyear wedge pattern on the monthly time frame.
Interestingly the pair retested the resistance of the descending channel dating back to October 2018. On Fridays close the pair stopped just at resistance at 1.0940.
At this juncture I would like to review what happened in March when we saw the pair breakout of the channel and stopped at 1.150 and we saw then a V shaped return to 1.0725 confluences of horizontal, channel and multiyear wedge supports. Could we see the pair rally to 1.150 or down to channel support in the coming days and weeks?
This is what I think needs to happen for a rally EURUSD needs to close above confluence of resistance 1.109/1.1110 to expose 1.1200, 1.1300 and 1.150.
Read also; CAF Distributes $10.8 Million to 54 Member Associations
It is important to also note that Friday’s candle is long tailed just like a pin bar which signifies selling pressure. Hence for the EURUSD to sell off which is most likely given that EUR has been throwing up weakness signals in its other major currency pairs. If the pair clears the low of Fridays candle with a close we might see it moving down. Support levels on the way down 1.0990, 1.090, 1.0825 and 1.0725.
Monday will be a decisive day as par the direction of the EUR.
NZDJPY
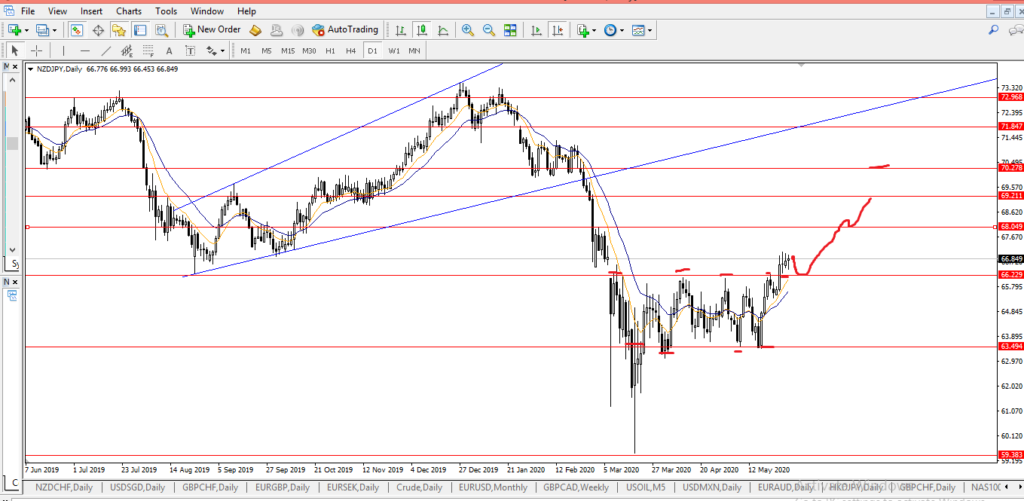

Fig 2: NZDJPY Daily Time Frame
NZD pairs failed to follow on its price action signals and patterns discussed here two weeks ago, those turned out to be false breaks. Now that is an intrinsic part of trading. No one should hesitate to move levels and patterns when the market stops respecting them.
Read more; Justice for Floyd – Musings from the Caribbean
NZDJPY rebounded from 63.50 to take out the range top 66.230 last Tuesday. It has since held above it any retest of 66.230 will most likely attract buyers. As long as NZDJPY stays above 66.230 68.05 and 69.211 and perhaps 7.0278 will be exposed.
Alternatively if the pair closes back below 66.230 that will negate the move and keep the kiwi bound.
EURCAD
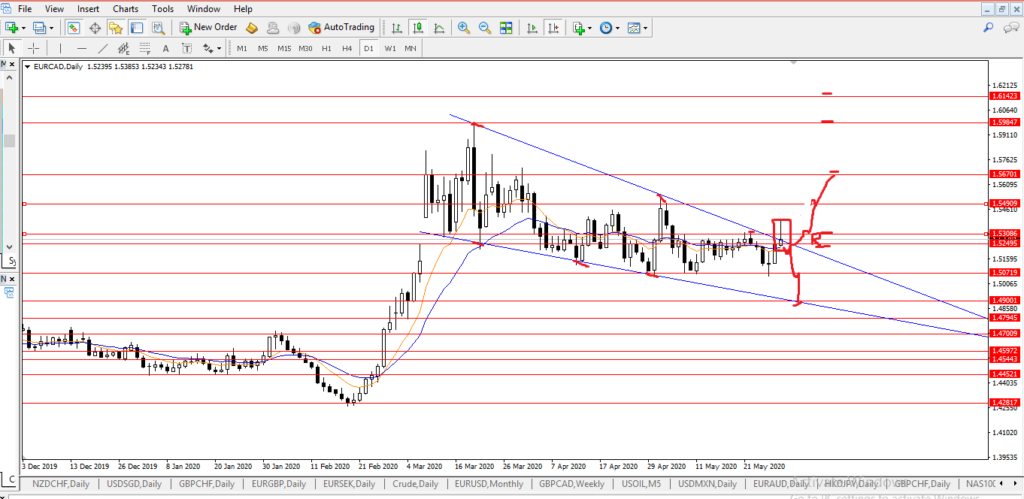

Fig 3: EURCAD Daily Time Frame
EURCAD just like EURUSD we discussed earlier is at a critical resistance zone 1.5250/1.530 this is the top off a falling wedge and two horizontal price zones that has resisted the pair since March. There is also a long tailed candle just at the top of the falling wedge. Before you rush to buy or sell this you need to apply some caution given the nature of the setup we need it to be neater and free of confluence like this.
Read further; SpaceX Dragon Capsule Docks at the International Space Station
That said it is best to wait for the pair to take out the low of Fridays candle to confirm a sell targeting 1.507 and 1.4900(wedge support) on the other hand a close above the confluence of resistance at 1.530 will confirm the break out with a 922 pips objective a little bit above 1.614 resistance at 1.6195 on a break out confirmation levels to watch are 1.5490 and 1.5670 and 1.5985.
Like EURUSD Monday will be a determining day for the EURCAD.
GBPUSD
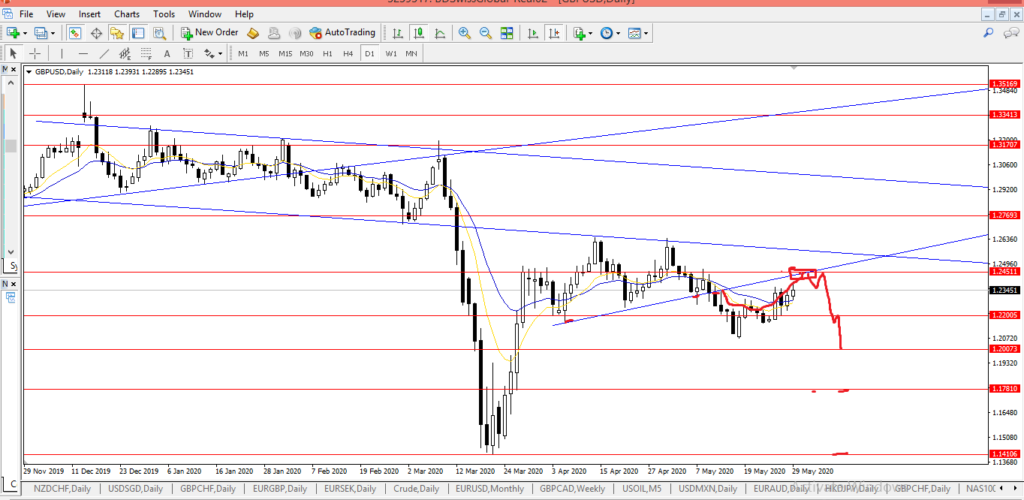

Fig 4: GBPUSD Daily Time Frame
GBPUSD after breaking out from the narrowing wedge we discussed three weeks ago was able to sell off 230 pips against a 466 pip objective before stalling I don’t think that the cable is done yet as it is moving towards confluence of resistance at 1.24511/1.2450 a test of that level might attract sellers more so that intersection might be producing a lower high against low formed at where the breakout stalled.
Should this scenario play out levels to watch include 1.2200,1.178 and 1.410.
EURGBP
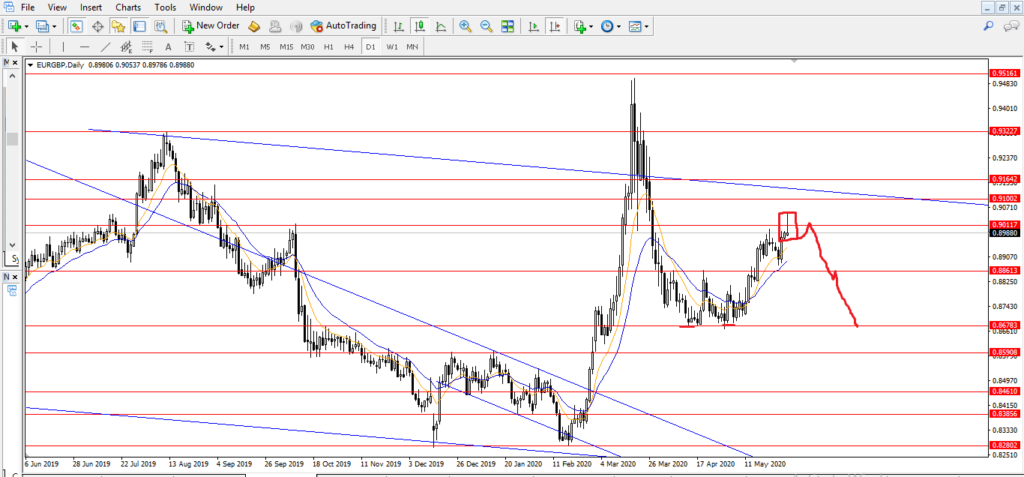

Fig 5: EURGBP Daily Time Frame
I decided to write about this pair because of the clear price action, talking about the bearish pin bar as you can see it is as clear and as perfect as any pin bar can get but that does not guarantee any sell off.
However there is a good chance that a retest of 0.9011 will attract sellers exposing 0.8860 and followed by 0.8670. If he pair takes out the high of the pin bar that will negate the bearish outlook we have here.
Written by:
Chijioke Maduakor
Disclaimer: Any person accessing this information and considering potential investment opportunities featured here should make their own commercial assessment of an investment opportunity after seeking the advice of an appropriately authorized or regulated financial advisor. This information should not be construed as advice or a personal recommendation to any prospective investor.